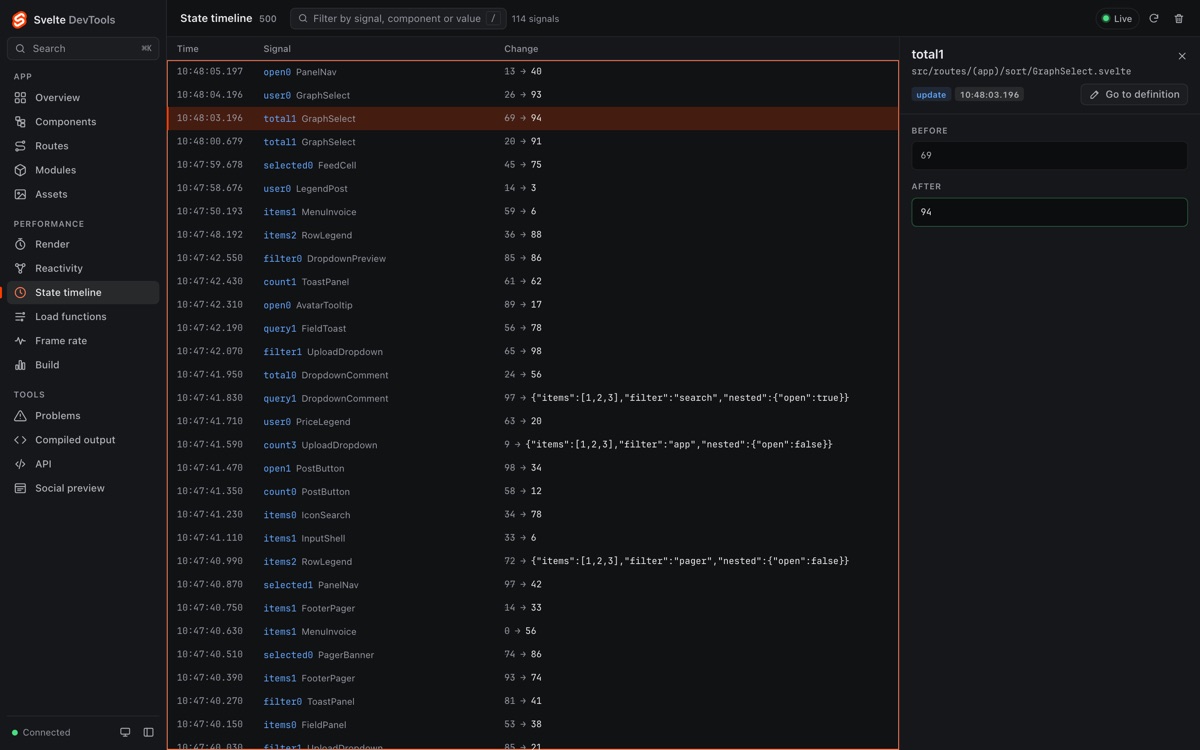
Know what changed, and when.
Recent $state writes, newest first, with the value before and after. The log keeps the latest entries, not the whole session.
Dev-mock mode with synthetic data, before the reactivity update.
Svelte 5 · SvelteKit · Vite
Components, reactivity and routes in the Vite DevTools dock, served by your Vite dev server.
npm install -D @sveltejs/vite-devtools-svelte @vitejs/devtools Needs Vite 8.3.5 or later and Svelte 5.46.4 or later. SvelteKit 3.3.0 or later is optional.
What you can see
The panels read your running app and your project while the dev server runs. Production builds are unaffected.
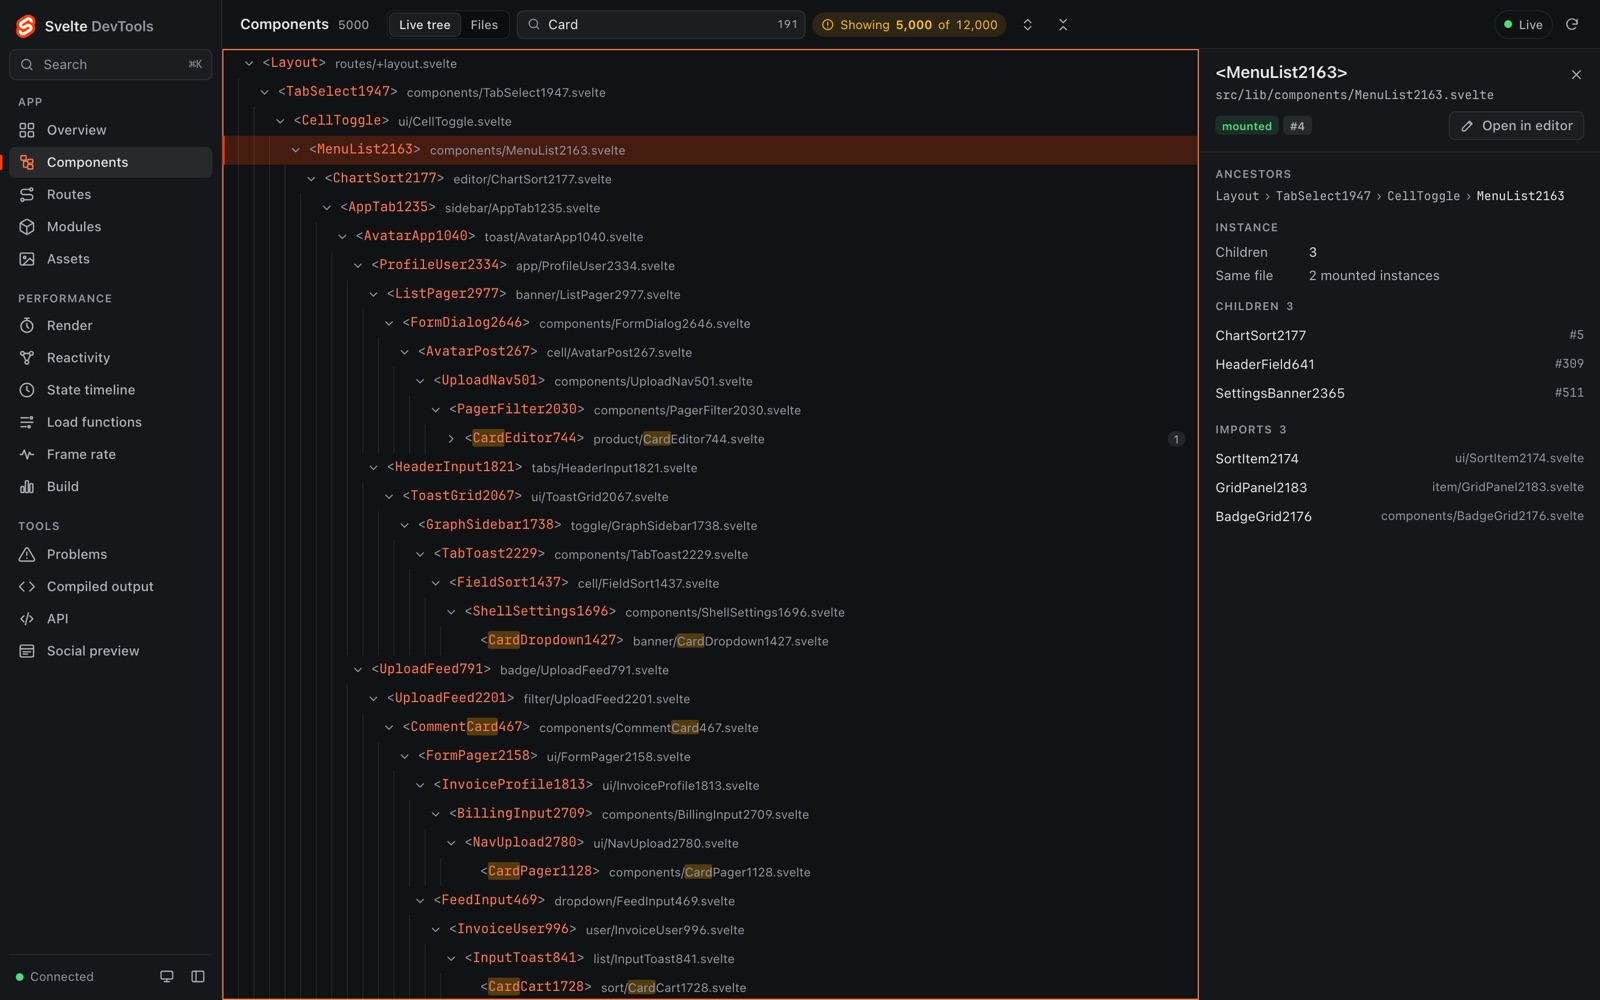
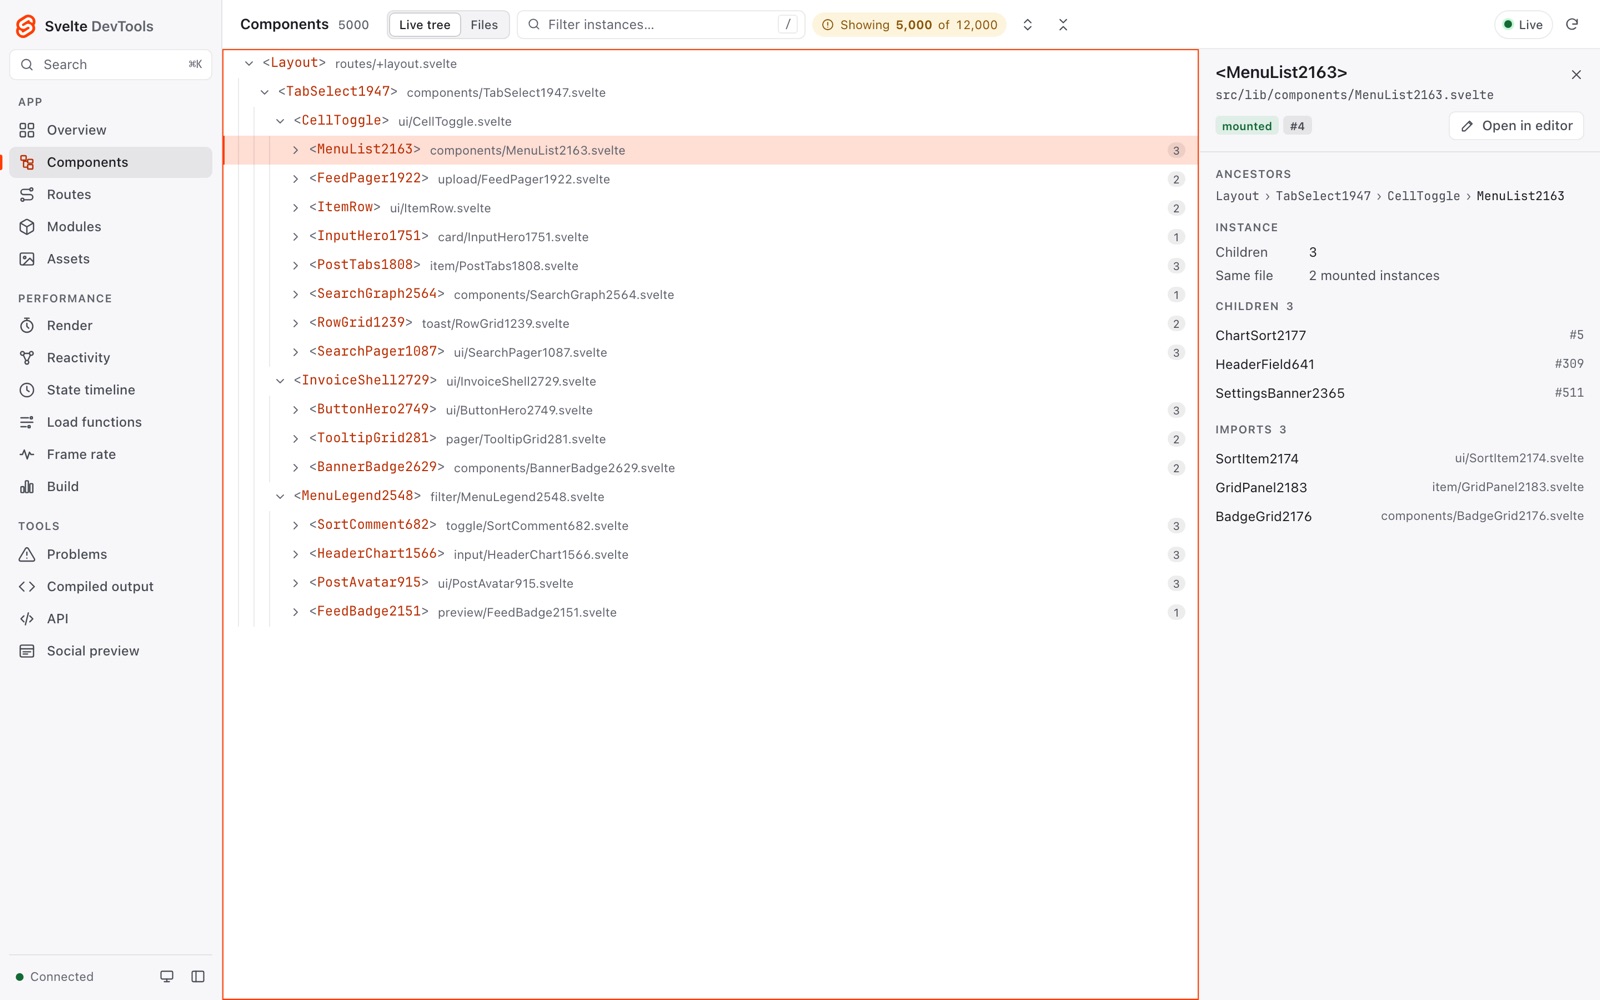
The live tree of mounted instances, virtualized for large apps, with an inspector for ancestors, children and imports.
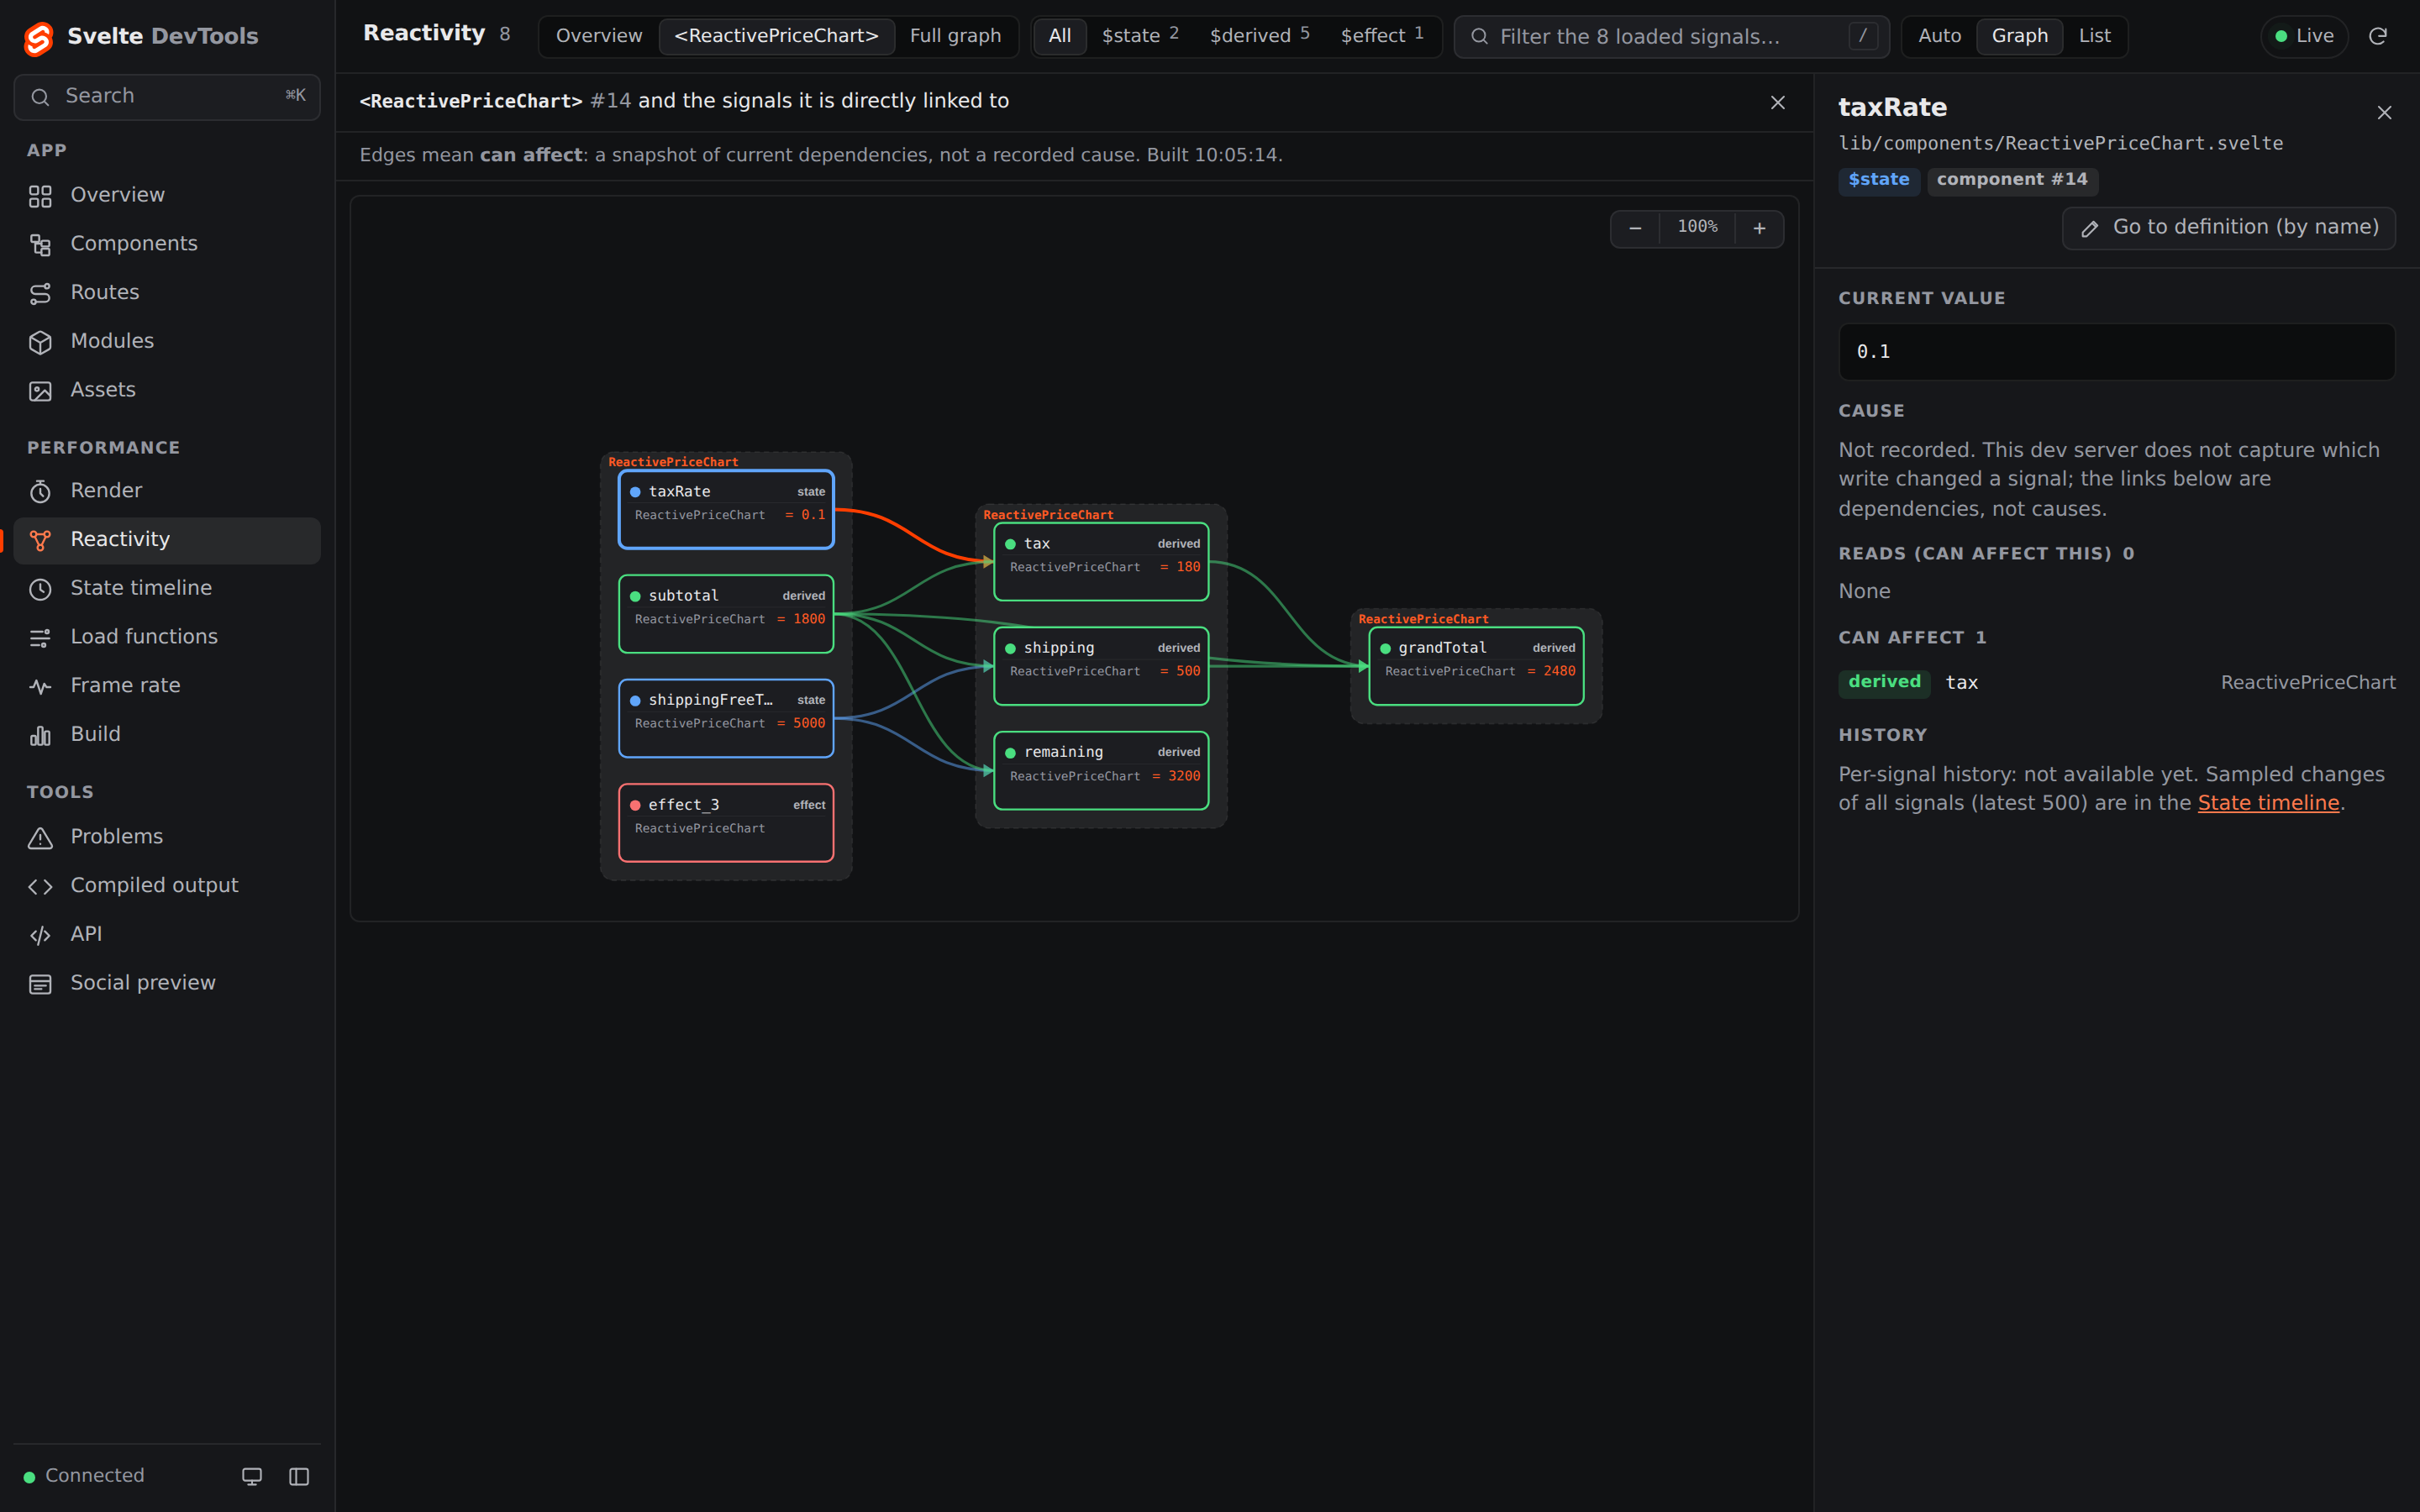
Panel detailsWhich $state, $derived and $effect connect inside one component. Edges mean “can affect”, not a recorded cause.
Panel detailsSampled $state changes, newest first, with the value before and after.
Panel detailsThe SvelteKit routes tree from your files, and how long each load function takes.
Panel detailsWhich components render most and take the longest, per instance.
Panel detailsReactivity in large apps
The overview counts sampled state changes and renders for each instance since it mounted, without building the whole graph. Pick one instance to see its signals and what can affect what.
Recent $state writes, newest first, with the value before and after. The log keeps the latest entries, not the whole session.
Dev-mock mode with synthetic data, before the reactivity update.
For AI agents
The dev server also serves an MCP endpoint with 20 read tools. Claude Code and other MCP clients get the same data as the panels, and every answer says what it covers.
Read the MCP guide$ npm run dev
…
svelte-devtools MCP ready — register it once with Claude Code:
claude mcp add svelte-devtools -- npx @sveltejs/vite-devtools-svelte mcp
Two ways to open it
Install @vitejs/devtools and set devtools: { apply: 'serve' } in your Vite config. The panels open in
the dock's Svelte tools group, next to the Svelte Inspector and the Add panel for sv add-ons.
Without Vite DevTools in your Vite config, open /.svelte-devtools/. The first
visit asks for the one-time code printed in your terminal; after that the browser is
trusted.
15 panels
$state, $derived and $effect connect$state changes, newest firstload functions take+server endpointsstatic/ or public/sv add-ons in one click